Updated
Oct 27, 2026
 12 min read
 Checked regularly

The picks-and-shovels businesses make money in any market
Tether reported more than $10 billion in net profit for 2025, 23% less than the year before, and ended the year with $141 billion in US Treasuries behind $186 billion of USDT in circulation. In the second quarter of this year, with bitcoin dropping below $60,000, Tether made another $1.5 billion. The company has one main source of income, interest on those Treasuries, and it barely depends on the bitcoin price. It does depend on the Fed: if rate cuts continue, Tether will earn less in 2027 on the same $186 billion, and for this model that is the risk I’d watch first. Circle runs the same model at a smaller scale: $701 million in revenue and $48 million in net profit for the quarter, with USDC in circulation up 19% year over year.
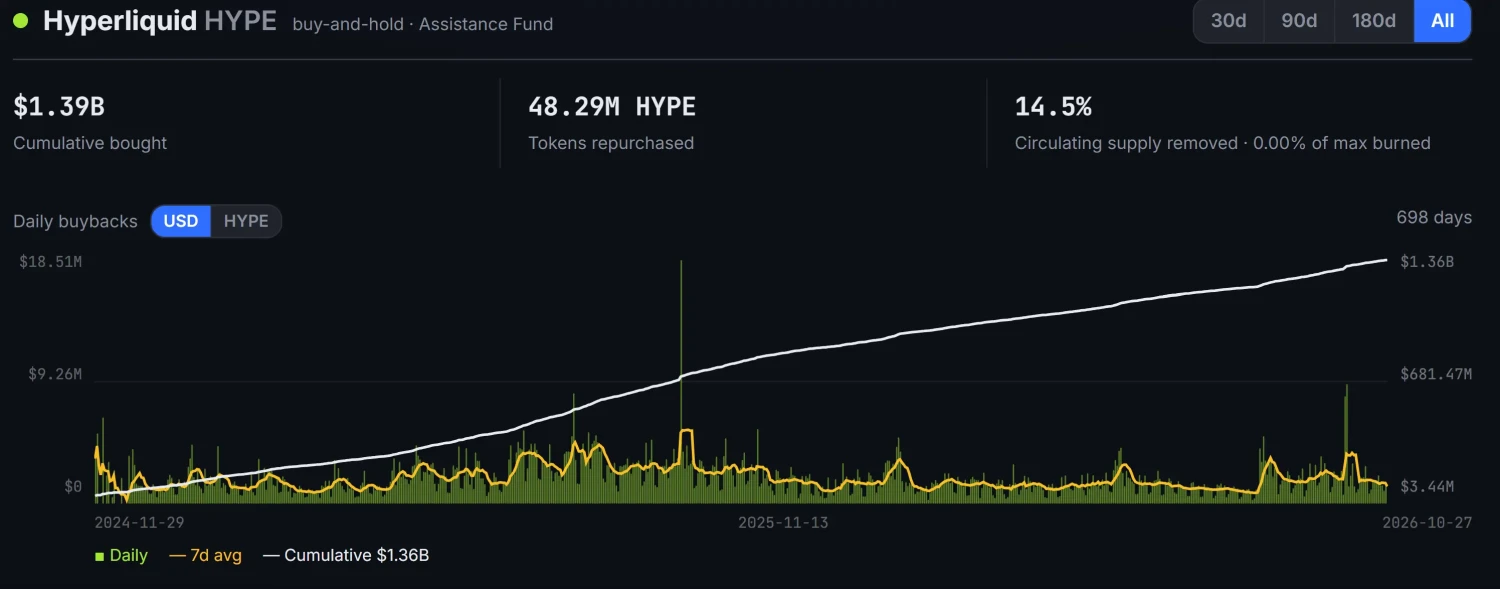
Exchanges earn on volume, not on direction. Hyperliquid sends almost 99% of its fees into HYPE buybacks and has bought $1.39 billion worth since late 2024. The pace is falling along with volumes: at the peak in the fall of 2025 the fund was buying $4-5 million a day, in 2026 it averages $1.5-2 million. But that is still more than a hundred million a quarter in a falling market, with no funding round and no investors.
Influencers mostly make money from retail traders, not from the market
A major crypto influencer’s income comes from:
- exchange affiliate programs
- paid posts
- their own tokens
Forecasts are not on that list.
Affiliate commissions are the biggest source of income. The exchange pays the influencer a share of the fees paid by every trader they bring in, for life. The rates are public: Bybit pays 30-50% plus 10% from sub-affiliates, Binance and OKX up to 50%, KuCoin up to 60%. Channels with hundreds of thousands of subscribers get different terms: flat fees per integration and monthly retainers. By InfluencerFee’s estimate, an integration on a channel with 500,000+ followers costs $25,000-150,000, and an exchange ambassador contract runs $50,000-500,000 a month.
Take Carl Moon’s YouTube channel. SponsorRadar tracks sponsored segments on YouTube, and for The Moon Show it counted 1,215 placements, 176 of them in the last year (the tracker appears to count brand-plus-video pairs, so the real number of videos may be lower, but that doesn’t change the order of magnitude). The sponsors include Weex, Bybit, Coinflare, Blofin, Pionex, Phemex, BTCC and MEXC. Twelve exchanges on one channel. Paid token posts are a separate line: ZachXBT published a spreadsheet in which more than 200 influencers were offered money to promote a token, around 160 accepted, and fewer than five labeled the posts as ads.
So where do the identical forecasts come from? Affiliate programs pay from fees, fees come from volume, and volume grows when the audience trades more often and with leverage, so what benefits the influencer is not that you make money but that you trade. And people trade when they believe the rally is about to start.
Here is what the biggest accounts on X and YouTube were posting in late October 2026, in short:
- Carl Moon (1.5M followers): BTC looks strong, a move up is coming
- Ash Crypto (2.1M): the ETH/BTC chart looks like it did right before the 2021 altseason
- Gordon (850K): a pump is ahead, ETH under 3k is a great price
- Capo Crypto (985K): the uptrend will continue
- Crypto GEMs (440K): a massive bull run is coming, your first 1000x is close
- Crypto Rover (1.5M): alts are about to fly, the next 3-6 months will be insane
The same people were writing roughly the same thing a year ago and two years ago. Back in 2022 Carl Moon promised $200,000 “within the next three years.” Crypto Rover wrote in February 2025 that altseason was coming back, and in April that it was inevitable. Altseason didn’t happen, and bitcoin went below $60,000. In 3-6 months there will be a new post about the next 3-6 months, and the audience pays for it: the influencer gets a cut of the trading fees through the referral link, and the exchange collects its fees either way, whether the trader wins or gets liquidated “ahead of altseason.”
Retail traders: the latest numbers
Futures. Stacy Muur, the same researcher who keeps the shutdown list, counted the addresses on Hyperliquid: about 75% are in the red. This isn’t a sample: the entire chain is public. Profits are concentrated in a few dozen addresses: one of the month’s leaders made 261,000 trades, another earned $4.48 million on 50 trades. The other three-quarters are the ones handing them that money.
Memecoins. According to Dune data as of January 2025, of 13.4 million wallets on Pump.fun, 0.4% made more than $10,000, and 294 wallets made more than $1 million. CoinGecko tracks it month by month: in a bad month 30% of active wallets finish in profit, in a good month 73%. Then again, two thirds of that 73% made between $1 and $500, so even a good month brings most people lunch money.
Leverage. Last year, $150 billion in positions were liquidated. On October 10, 2025, $19.16 billion went in a single day, an all-time record, and 85-90% of that was longs.
Which way the crowd is leaning shows in the long/short ratio. When bitcoin had fallen 35% from its high, the long/short ratio among large Binance accounts climbed to 3.87, a three-year high, even though at the all-time high the same reading had been below 0.6. They were buying with leverage on the way down, right under those altseason posts. Then came $60,000.
Put it together: the crowd comes in after the rally and buys the dip, sits long with leverage, and on every one of its trades the exchange takes a fee from both sides while the influencer takes a cut of that fee. The income in the first section is made of the losses in this one.
Now the projects: what Grayscale’s numbers show
That leaves the most interesting group: the people building products. Grayscale Research calculated two metrics for tokens. Centralized projects are excluded.
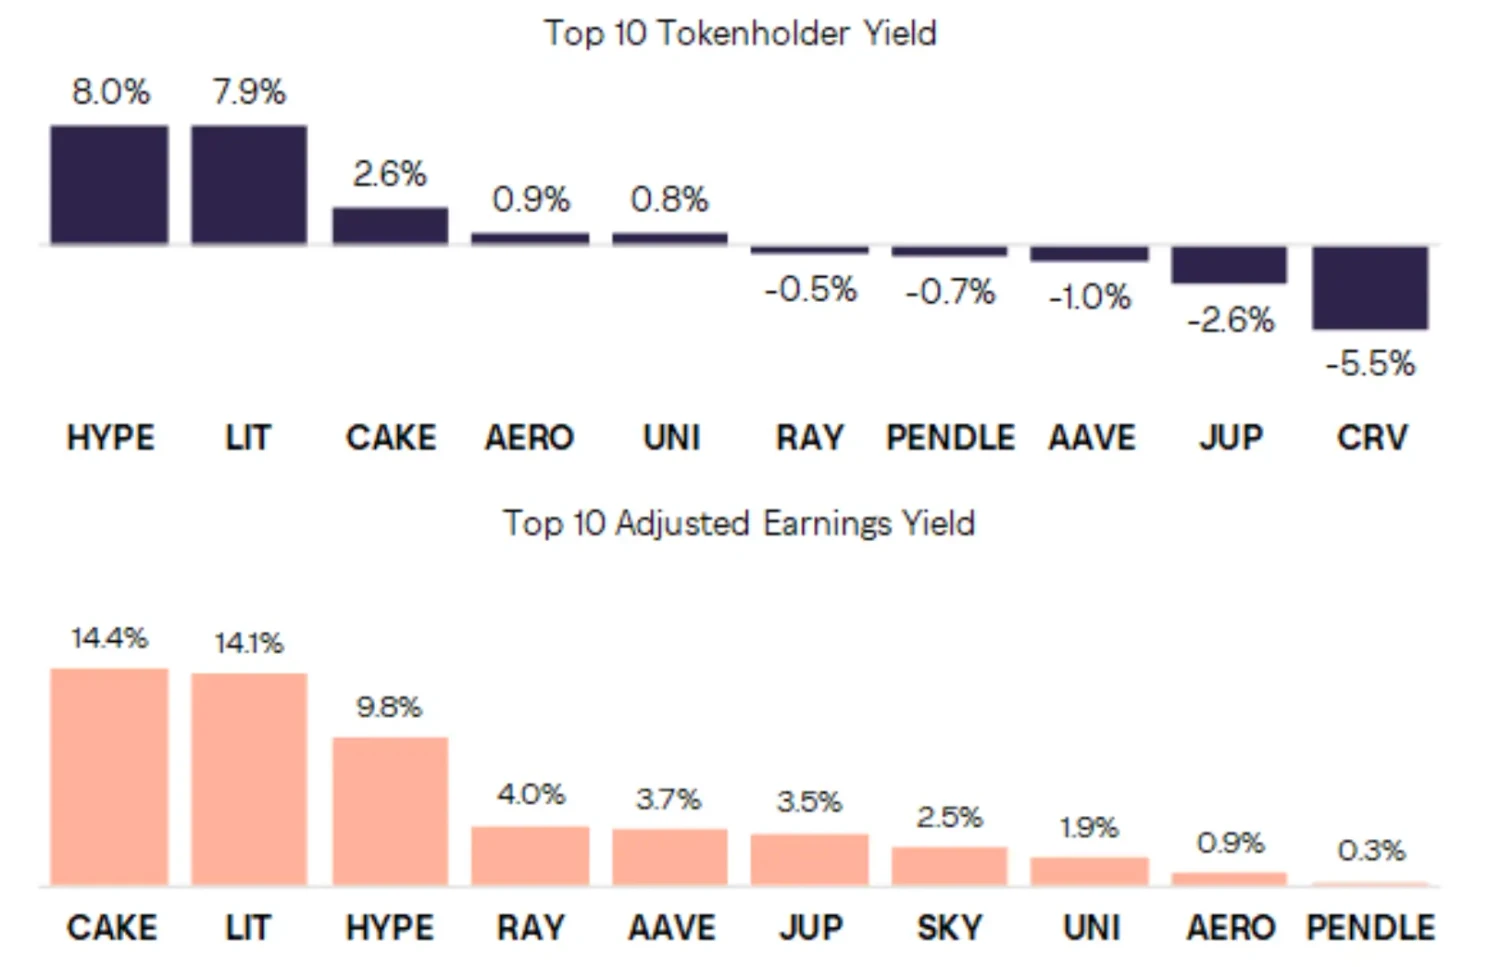
The first, Adjusted Earnings Yield, is earnings yield adjusted for growth in token supply. In effect it’s an inverted P/E with issuance already subtracted. I converted it into the familiar form (one divided by the yield, rounded to whole numbers):
- CAKE about 7
- LIT about 7
- HYPE about 10
- RAY 25
- AAVE 27
- JUP 29
- SKY 40
- UNI 53
- AERO 111
- PENDLE 333
The S&P 500 trades at around 25-30 times earnings. CAKE, LIT and HYPE are cheaper than the US index; UNI, AERO and PENDLE are several times more expensive.
The second metric matters more. Tokenholder Yield shows how much of what was earned actually reached the holder: buybacks, burns and staking minus issuance and unlocks. Think of it as a gauge of whether the token’s economics work for you or against you rather than as a yield on your deposit. This is the number that never makes it into the pitch deck:
- HYPE +8.0%
- LIT +7.9%
- CAKE +2.6%
- AERO +0.9%
- UNI +0.8%
- RAY -0.5%
- PENDLE -0.7%
- AAVE -1.0%
- JUP -2.6%
- CRV -5.5%
Of ten protocols with real revenue, only two have a tokenholder yield above 5%. Five come out negative: the protocol earns, but the holder gets diluted faster than they get paid. The most telling case on this list, Raydium, deserves its own section.
Making money and paying it out are two different things
Many earn, few share, and Raydium is the best example of the gap. A P/E of 25, growing revenue, and a negative holder yield. How does that work?
For the quarter, Raydium’s net revenue came to $7.99 million, up 264% on the previous one, and $5.23 million went into RAY buybacks. Cumulatively the protocol has bought back $204 million worth of tokens, and the buyback wallet holds 87.5 million RAY, 32% of the entire circulating supply. And the protocol doesn’t burn them. They sit in a public wallet, and what happens to them will be decided by a vote.
The market has noticed: in a little over a month RAY went from $0.81 to $2.21. The negative number in Grayscale’s table isn’t there because the tokens weren’t burned: the methodology counts a buyback either way, and Hyperliquid, which also keeps its HYPE in a fund, comes out at plus 8%. For RAY, new issuance and unlocks over the past year outweighed the buybacks relative to market cap, and the revenue spike only arrived in September, so it has barely made it into the annual figures. There is a second risk the metric doesn’t capture: a third of the supply sits in the protocol’s wallet and can come back onto the market by DAO decision, so a RAY holder is essentially sitting on an option: burn or no burn. By comparison, CAKE, AAVE, JUP and HYPE put more than 80% of profits into buybacks or staking, yet AAVE and JUP still come out negative because unlocks outweigh the payouts. That’s why in the Grayscale report I look at the second metric first and the first one after.
Three tokens, three outcomes
Two perp DEXs, one L2 that lived off a perp DEX, and three very different outcomes for tokenholders.
Hyperliquid. Almost 99% of fees go into HYPE buybacks: the fund has collected 48.3 million tokens, 14.5% of the circulating supply, and holds them rather than burning them. It’s the only project on Grayscale’s list with a P/E around 10 and an 8% holder yield. On top of that, under an agreement with Circle and Coinbase the exchange receives up to 90% of the yield on USDC held on the platform, meaning it earns even when traders simply keep stablecoins in their accounts.
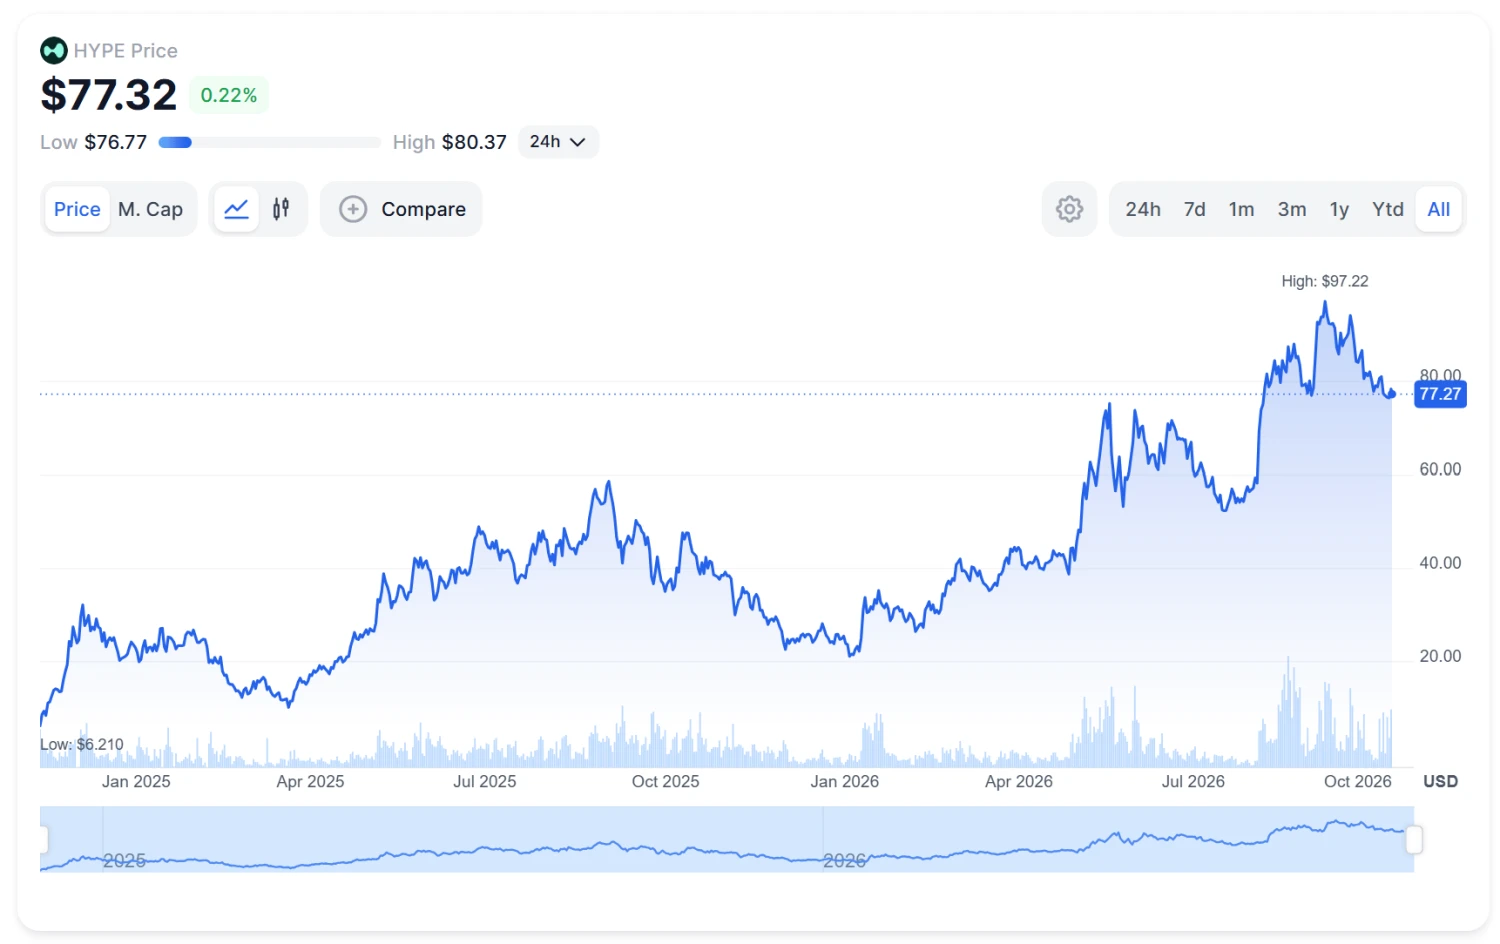
Lighter. The opposite model: zero fees for retail, income from market makers and large accounts. It burned 15.6 million LIT over the summer and another 2.45 million in the quarter, 30-day volume is around $59 billion, and the 6% staking yield is paid from reserves rather than from issuance. A P/E of about 7 and a holder yield of 7.9%. Then again, the token is less than a year old, and nobody has yet seen how this model survives a long slide in volumes.
Extended and Starknet. A story about how income leaves in a week. Extended, a perp DEX on Starknet, held $120 million of the network’s $158 million TVL. The team announced a move to Arc, Circle’s network. Starknet’s TVL dropped to $42 million, down 73%. STRK had risen 120% on expectations beforehand and lost 58% after the news. If an L2’s entire TVL sits in one application, then what you’re really holding is that application’s token, just without its economics.
A centralized exchange token works the same way and lives exactly as long as the exchange does. When BitMart announced its closure, BMX fell 58% in a day. So for the big venues I look at trading volume, at the share of fees that actually goes back to holders, and at how the exchange got through this year. For the eight largest venues we broke those down in our crypto exchange reviews.
The biggest names that went under
In Muur’s list the caliber of the names matters more than the count. I’ve sorted the most notable ones by segment, because that shows where the market is hurting most.
NFT. Blur was the largest NFT marketplace by volume and in 2023 was outpacing OpenSea. Peak monthly volume was $1.43 billion; before the shutdown it was under $7 million, down 99.5%. BLUR went from $5 at its peak to a cent and a half. Blend, the largest NFT-backed lending service, is closing along with the marketplace, and I don’t see a replacement for either on the horizon.
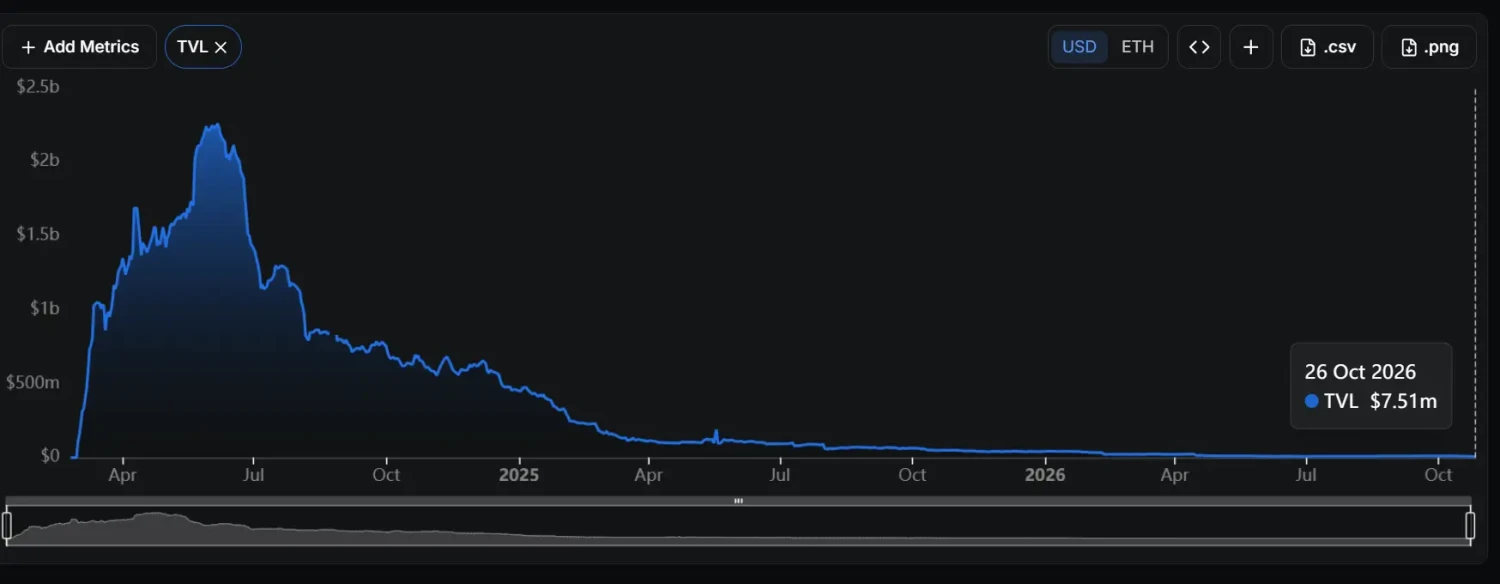
L2. Four networks closed in a year, and Starknet, which I covered above, lost three quarters of its deposits.
| Project | What it was | What happened |
| Blast | L2 from the Blur team. More than $2 billion in deposits before launch, peak TVL $2.2 billion | Costs above revenue, “no credible path” to sustainability. TVL at the announcement: $32 million, three weeks later $7.5 million |
| Abstract | L2 from Igloo, the parent company of Pudgy Penguins. 144 apps, 400,000 users, partnerships with Red Bull Racing and Disney | Igloo funded the network for a year and a half, losses in the “tens of millions.” Decided against issuing a token |
| Polygon zkEVM | zk-rollup from Polygon Labs | Switched off with no public reason |
| Zero Network | Gasless L2 from Zerion | Lasted a year and a half |
The cause is shared. An L2 earns on transaction fees, and after the Ethereum upgrades those fees became pennies, so covering a team’s costs takes billions in volume, which is enough for three or four networks out of the several dozen that launched.
Exchanges. Four venues with almost forty years of combined history.
| Exchange | Years | What happened |
| BitMEX | 11 | Closed after a “strategic review.” Assets exceed liabilities, withdrawals work |
| CoinEx | 9 | The CEO named the reasons outright: a prolonged winter and compliance costs. Reserves above 100%, a three-month withdrawal window |
| BitMart | 9 | Gave no reason at first. Later admitted a $319.5 million hole in the balance sheet going back to the 2021 hack. Withdrawals restricted, a court-backed restructuring in the works: users will be offered a share of liquid assets or claim tokens |
| AscendEX | 8 | A liquidity deal fell through. Automated withdrawals stopped, no guarantee of repayment |
BitMEX and CoinEx users are getting everything back. AscendEX says it “cannot give assurances about timing or amounts,” and BitMart lived with a hole in its balance sheet for five years and only disclosed it after announcing the closure. Where to keep your money follows from that comparison, in my view, without further comment.
DeFi. Here the trigger was a hack. Balancer, with a peak TVL of $3.3 billion, closed after a $110-128 million exploit, with 99.2% of BAL holders voting in favor. Radiant lost $50 million to theft and saw its TVL fall from $387 million to $5 million within a month. Step Finance closed after a $40 million treasury breach, with STEP down 96%.
Here’s what they have in common. None of them died from a lack of users: Blast collected $2 billion before launch, Blur overtook OpenSea, BitMEX invented the product Binance and Hyperliquid now make their money on. The triggers differ: hacks in DeFi, collapsed deals, old balance-sheet holes and compliance costs at the exchanges, penny fees on L2s. None of them had enough of a cushion, some had it eaten by a hack, some by two years without revenue, and new money stopped coming into the industry because investors, judging by the numbers in the last section, switched to projects tied to artificial intelligence.
What to do with your portfolio
Two questions for every position.
First: does the protocol earn, and does it reach the token? Two lines from the Grayscale report. If there is revenue but Tokenholder Yield is negative, you’re holding a token tied to a protocol that earns, but none of that is reaching you.
Second: how much does it need to rise to get back to zero? The math here is counterintuitive:
| Drawdown | Gain needed to break even |
| -25% | +33% |
| -50% | +100% |
| -70% | +233% |
| -80% | +400% |
| -90% | +900% |
| -95% | +1900% |
A token that has dropped 90% has to go up tenfold just to get you back to even. When I was working out this table, the last row looked like a typo, but +1,900% is just arithmetic. BLUR from $5 to a cent and a half is minus 99.7%. That doesn’t come back. Well, almost never.
Four checks I run myself:
- Does the money reach the token. Buybacks with a burn, or staking paid from profits rather than from issuance. A buyback into a wallet without a burn, as at Raydium or Hyperliquid, I count as half.
- Who pays the team. If a protocol lives off a treasury from a round three years ago and revenue doesn’t cover salaries, it has a death date; you just don’t know it. Blast and Abstract closed exactly that way.
- Where the assets sit. The token can be fine while the network or exchange underneath it shuts down. Extended pulled 75% of Starknet’s TVL in a week. AscendEX isn’t guaranteeing refunds.
- Prospects. If a team is actually shipping a product or close to it, no profit today is not a death sentence. The token price may simply reflect the fact that money has stopped coming into the industry. The key is telling a temporary funding squeeze from a business model that never worked.
Don’t miss the withdrawal window
The withdrawal window at a closing project is always shorter than it looks. At Blast, normal withdrawals through the interface worked for three and a half weeks. At CoinEx, three months. At AscendEX, automated withdrawals stopped the day of the announcement. BitMart restricted withdrawals and only revealed the balance-sheet hole two months after announcing the closure. Abstract’s team warned outright: once the network is switched off, access to funds may be lost forever.
A working exchange can close the window too. In October, Bitget added Russia and Belarus to its list of prohibited jurisdictions and gave users four days: the announcement on the 17th, no new positions from the 18th, a withdrawal deadline of the 21st in the notices. After the deadline, positions were force-closed, and then the Russian-language version of the site disappeared. MEXC left the same market in the same days, but with individual notices and deadlines. An exchange can leave any country, that’s its right, but four days to withdraw is what I would call an ultimatum, and the market remembers things like that for a long time.
My rule: the project announces a closure, you withdraw in the first week. You don’t wait for clarity, you don’t wait for a better price, you don’t wait to figure out what happens to the token. If you have anything on a venue from Muur’s list, check it today.
What to expect in 2027
I wouldn’t call the shutdowns a “market cleanse.” They’re a consequence of where the money went.
Bitcoin dropped below $60,000 over the summer, gained 43% in the third quarter, and trades around $80,000. The market looks like it has come back to life. But look at the money coming into the industry, not at the price of a single asset.
Venture. According to CryptoRank, 127 rounds worth $2.62 billion went into crypto in the third quarter: 60% fewer deals and 40% less capital than a year earlier, meaning a year ago there were more than three hundred rounds. Per Tiger Research, DeFi investment fell 71%, and DeFi’s share of the total is 3%. That, I think, is why Muur’s list grows every week: the 2021-2022 projects are eating through their treasuries, and if I were them I wouldn’t count on a next round.
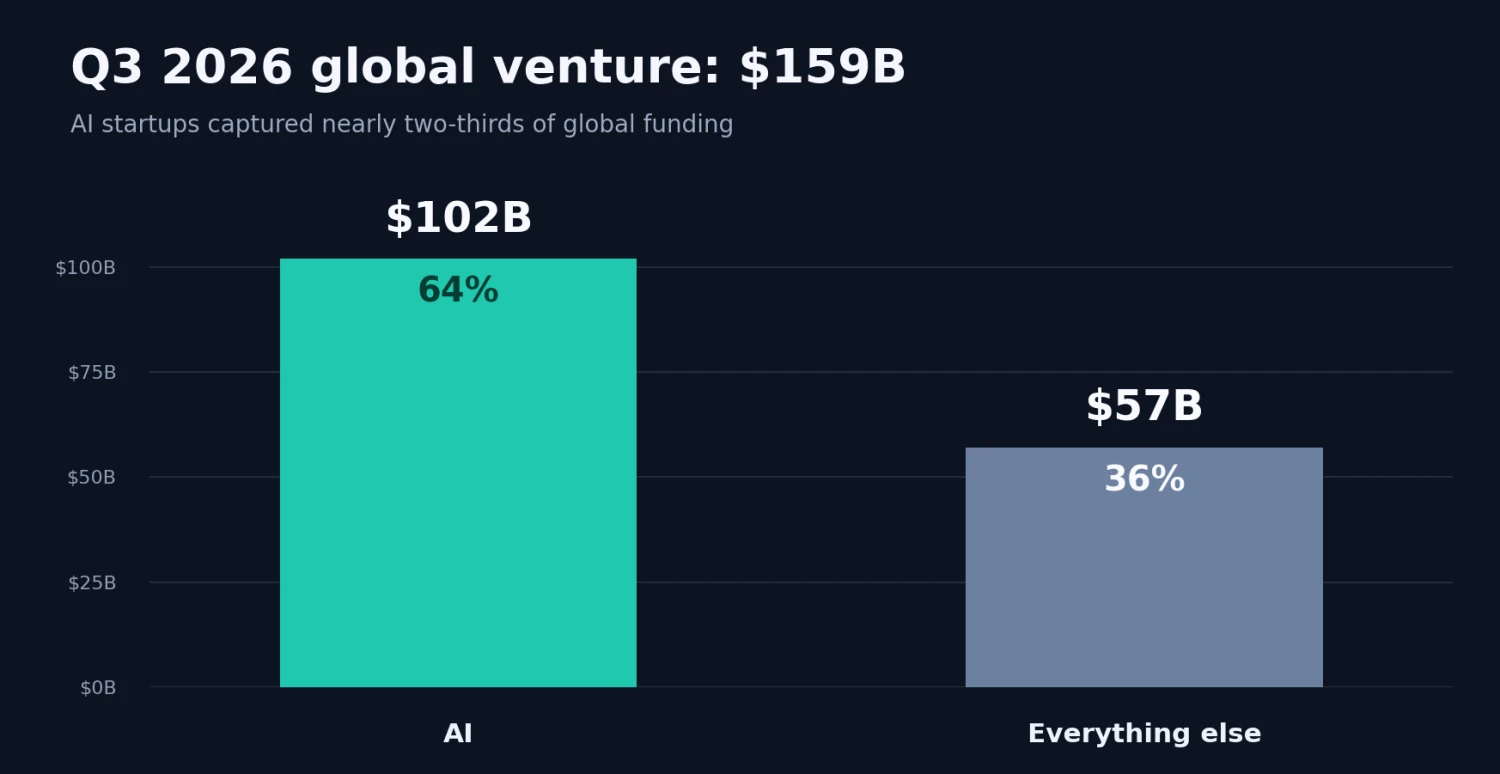
Where the money went. According to Crunchbase, global venture grew 53% in the same quarter, to $159 billion. Of that, $102 billion, or 64%, went to AI. The largest tech companies are spending on the order of $700 billion a year on AI and data centers. Nobody has measured a direct flow from crypto into AI, but investors’ priorities are visible in the numbers. Capital didn’t shrink. It moved.
Liquidity. Stablecoin market cap fell to $305 billion in the second quarter, per CoinGecko, the first quarterly decline since 2023. June saw a $7.7 billion outflow, the largest since May 2022. Bitcoin ETFs are net negative for October. Stablecoins are the cash sitting in the market’s accounts, and when the cash leaves, demand for everything else leaves with it.
Two scenarios follow.
- First: AI keeps absorbing capital. Crypto venture stays at $2-3 billion a quarter, stablecoins flatline, ETFs see no inflows. Bitcoin holds on institutional demand, while altcoins with no revenue and no buybacks keep extending Muur’s list. The same players keep earning: stablecoin issuers, exchanges with volume, and a dozen protocols from the top of Grayscale’s table.
- Second: the AI bubble deflates. Money goes looking for a new story, and in 2017 and 2021 crypto was the first to catch the cheap money. Whether that happens a third time, I don’t know. Until then, liquidity may stay scarce for a long while, because nobody is going to cancel a mega-round for a protocol with a P/E of 333.
Which scenario to bet on, I won’t say. Roughly the same players survive in both: projects with revenue that reaches the token, and venues that earn on volume. Muur’s list will be longer in 2027; of that I’m nearly certain. Picking the next Hyperliquid is something I most likely won’t manage, but staying out of the next Blast is entirely doable, and the checks in the portfolio section are enough for that.